Join us at AGG1, St Louis, MO - America's Center Convention Complex: 25-27 March
You’ve probably heard of Overall Equipment Effectiveness (OEE)—maybe your company even uses it as a key performance indicator. But do you fully understand what it is or why it’s so important for your organization? And then there are the tricky questions: How do you calculate a reliable OEE score? What’s considered a good OEE score? Which features matter most when choosing an OEE monitoring system or tracking software? This article breaks it all down, answering your biggest OEE-related questions.
We cover:
Contact us
What is an OEE Monitoring System?
To understand what an OEE monitoring system is and how it can help you, let’s first break it down to the basics.
Overall Equipment Effectiveness (OEE) is a key performance metric to assess how efficiently equipment is used. OEE tracks three critical factors:
- Availability – Measures downtime due to maintenance, breakdowns, or setup changes.
- Performance – Analyzes machine speed and efficiency.
- Quality – Identifies production defects and waste.
By implementing an OEE tracking system, businesses gain a clear view of inefficiencies and areas for improvement, ultimately driving higher output, quality, and profitability. In doing so, they will also likely contribute to more sustainable operations by extending asset lifespan. Although the OEE is credibly recognized worldwide as a gold standard in measuring productivity, how it’s applied varies wildly by industry and even between companies within similar industries. Comparing systems and machines proves valuable when they share the same function and purpose—particularly when identical products are produced through an identical manufacturing process.
Bearing the above in mind, there is still a standard formula for calculating an OEE score. Here we walk you through it step by step.
The standard formula to calculate OEE
Using the three key factors above: availability, performance, and quality – multiply these to calculate the OEE and get a percentage score to help you benchmark and evaluate efficiency across your equipment.
OEE = Availability x Performance x Quality
Each unit is expressed as a percentage (%), helping businesses reach a final OEE score once they’ve been multiplied.
Let’s say a machine is scheduled to run for 8 hours (480 minutes) but has 60 minutes of downtime due to maintenance. During its actual run time, it produces 90 parts per hour, but it could theoretically produce 100 per hour. Out of the total produced, 95% are good quality with no defects.
Step 1. Calculate Availability
Availability = (Actual Operating Time / Planned Production Time) x 100.
So, put in numbers, from the example above this is: (420 / 480) x 100 = 87.5%, i.e., the availability percentage score.
Step 2. Calculate Performance
Performance = (Actual Output / Maximum Possible Output) x 100.
Again, using the example above this translates into (90/100) x 100 = 90%, i.e., the performance percentage score.
Step 3. Calculate Quality
Quality = (Good Output / Total Output) x 100.
As total output is always 100%, if the good output is 95%, your quality percentage score is 95%.
Final Step. Calculate OEE
OEE = 87.5% x 90% x 95% = 74.8%
What does this mean?
An OEE score of 74.8% means the machine is running efficiently, but there may be room for improvement. To increase OEE, the company should try reducing downtime (improving Availability), increasing the speed (boosting Performance), or improve quality control processes reducing defects (raising Quality).
In other words, OEE helps businesses identify where they are losing efficiency so they can improve productivity and reduce costs.
Book a demo
A tale of two OEE scores... (or just an example comparing two scores!)
Even though most companies strive for higher OEE scores, bear in mind that a higher OEE score alone does not show the whole picture. Let’s demonstrate with the following example, where we do two quick OEE calculations and then compare the results.
Example 1: Higher Quality, Slightly Lower OEE
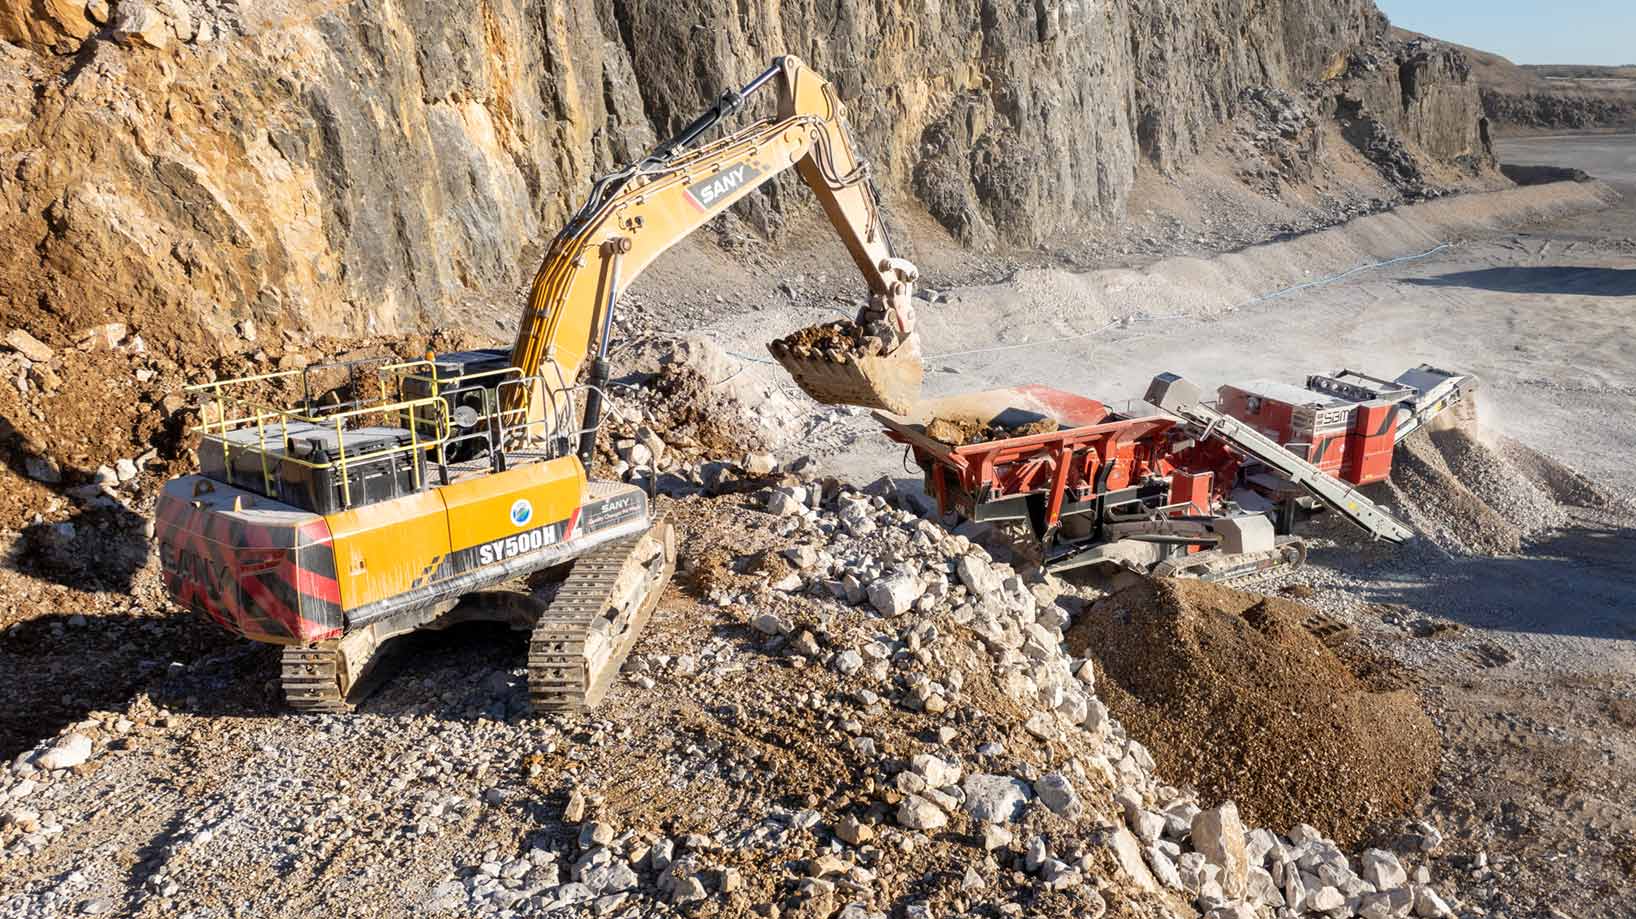
A crushing plant is processing aggregates, and the focus is on minimizing waste and maximizing high-quality output. They have the current score for each item:
- Availability = (8.5 / 10) × 100 = 85%
- Performance = (420 / 500) × 100 = 84%
- Quality = (4,100 / 4,200) × 100 = 97.6%
OEE = 85% x 84% x 97.6% = 69.7%
Example 2: Slightly Lower Quality, Higher OEE
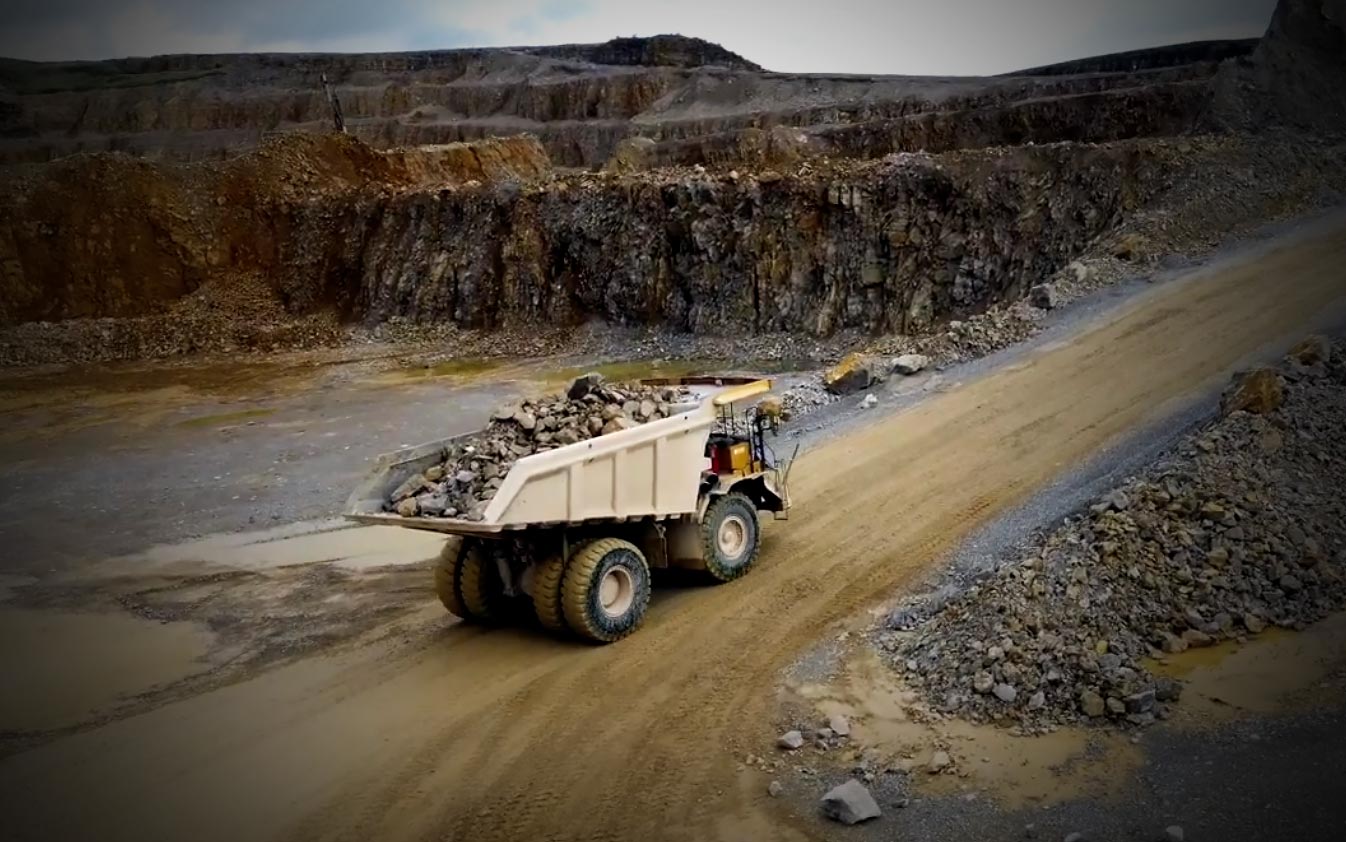
A quarry operation is focused on maximizing output, but in the process have varying quality in the material produced. They have the following score for each item.
- Availability = (9 / 10) × 100 = 90%
- Performance = (450 / 500) × 100 = 90%
- Quality = (4,300 / 4,500) × 100 = 95.6%
OEE = 90% x 90% x 95.6% = 77.4%
On the face of it, the first operation may come off as least desirable with their lower OEE score, but most businesses would not swap a higher quality score simply to increase their OEE score. If you only focus on maximizing OEE without looking at Availability, Performance, and Quality individually, you might optimize the wrong things. A high OEE with lower quality could mean more rework or rejected materials, whereas a slightly lower OEE with higher quality may lead to better customer satisfaction and long-term cost savings.
The takeaway? Ensure you have the full picture and do not stare blindly at the OEE score alone.
5 Key Benefits of OEE Monitoring Software
If an OEE score isn’t something we should stare blindly at, is it even worth using OEE monitoring software or tracking OEE at all? The answer is yes! While you shouldn’t view an OEE score in isolation, monitoring and benchmarking OEE, can provide valuable insights and truly improve how efficiently your operations are running.
Here are five key benefits of keeping up with OEE monitoring.
1. Minimizing Downtime
Unexpected machine failures lead to costly production halts. OEE monitoring software provides real-time alerts, helping teams proactively address maintenance issues before they escalate.
2. Increasing Productivity
With an OEE machine monitoring solution, manufacturers can track real-time performance data and make informed decisions to improve operational efficiency.
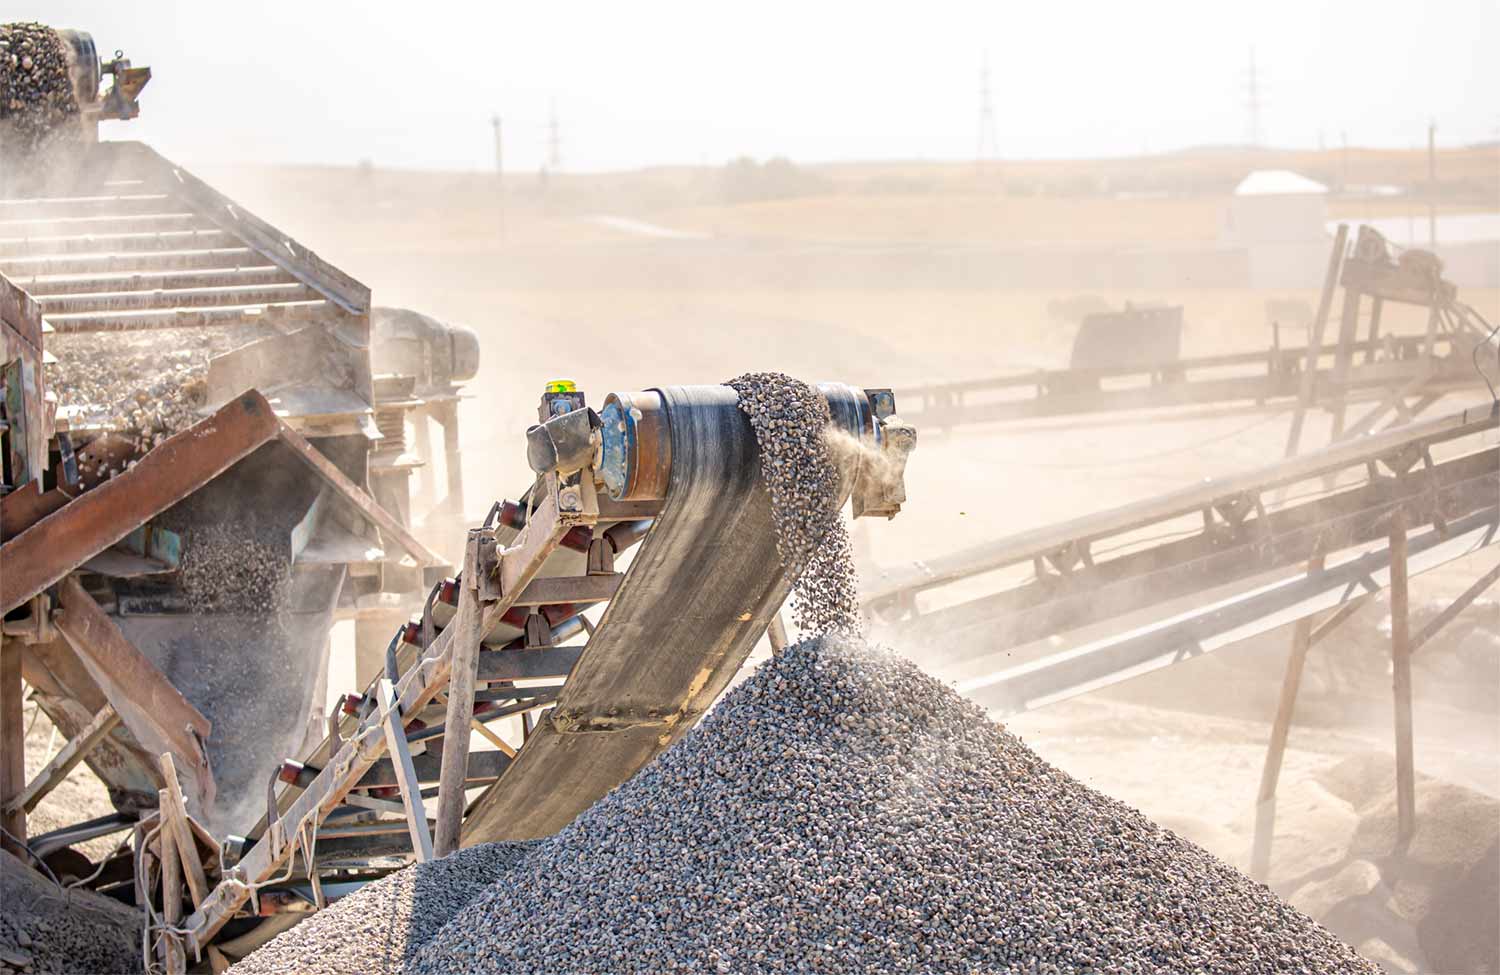
3. Improving Quality Control
Defective products impact overall yield. An OEE system helps monitor quality metrics, reducing errors and ensuring consistency across production lines.
4. Data-Driven Decision-Making
An OEE tracking software solution delivers actionable insights, enabling plant managers to identify trends, implement corrective measures, and optimize workflow processes.
5. Extending Equipment Lifespan
Predicting maintenance needs, avoiding machine breakdowns, and extending the lifespan of machinery with all the associated costs is not just great for the environment, but also the bottom line. Win-win!
How OEE Tracking Software Works
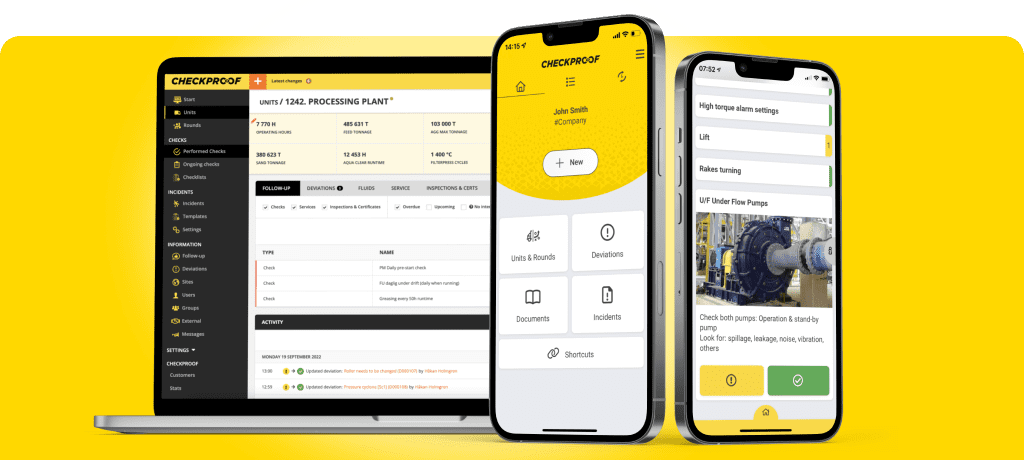
The key function of OEE monitoring software is to stream usage data directly from your fleet and heavy equipment to let companies understand their asset availability and productivity. By connecting to your assets, it can also work effectively as a predictive maintenance tool, ensuring that triggers alert to any potential machine failure, minimizing downtime in the process. Key functionality should include:
Real-Time Data Collection
Modern OEE monitoring software integrates with IoT sensors and machine interfaces to gather real-time performance data.
Automated Reporting & Analytics
OEE tracking systems generate detailed reports, allowing teams to analyze trends, pinpoint inefficiencies, and track improvements over time.
Seamless Integration with Existing Systems
A robust OEE monitoring system integrates with your fleet and existing systems, ensuring a streamlined workflow across different departments.
At the heart of it, an effective OEE system will also help with seamless machine management.
An effective OEE monitoring system can be a game-changer for industries looking to optimize machine efficiency and enhance overall productivity. By investing in OEE tracking software, businesses can reduce downtime, identify bottlenecks, optimize processes, and improve quality control - making data-driven decisions that drive long-term success.
Contact us
Want to know what CheckProof can do for you?
CheckProof's easy-to-use app makes it easier to do the right thing at the right time. Discover how you can run world-class maintenance that is both cost-effective and sustainable.
Book a demo

2025-03-07
Maximize Efficiency with an OEE Monitoring System
You’ve probably heard of Overall Equipment Effectiveness (OEE)—maybe your company even uses it as a key performance indicator. But do you fully understand what it is or why it’s so important for your organization?

2025-02-27
Plant Asset Management Software:Maximizing Equipment Uptime
Keeping assets in top shape and extending their lifespan is a key priority for maintenance managers—right after preventing equipment failure and downtime! In the construction materials industry, where heavy equipment and infrastructure are essential, keeping assets in peak condition is crucial for maintaining efficiency and reliability.
2025-02-21
Machine Downtime Tracking: The key to smarter, more efficient operations
Gain control over equipment performance, minimize downtime and costly disruptions with data-backed maintenance decisions.

2025-02-07
CMMS Software: What it is and why it’s key to First-Class Maintenance Operations
A CMMS or Computerized Maintenance Management System is essential to everyday maintenance management and business operations. Whether you’re new to CMMS software tools, considering an upgrade, or exploring their impact on your business, this article covers everything you need to know.
2025-01-10
Revolutionizing Compliance: Banner Contracts on managing ISO audits with CheckProof
CheckProof speaks to Brett Burrows from Banner Contracts on securing processes and ISO Compliance with CheckProof.

2024-12-13
Implementation of Digital Systems: Rolling Out CheckProof Across Teams
Implementing new digital tools can be challenging, especially when teams resist change. In this blog, industry leaders from Cemex, Breedon Group, Banner Contracts, and Peab Industry share their insights on successfully rolling out CheckProof. Discover practical strategies, lessons learned, and the measurable benefits of driving digital transformation across operations.
2024-11-26
Von Kraftstoffeinsparungen bis hin zu Produktionssteigerungen: Wie Cemex Deutschland erfolgreich CheckProof implementiert hat
Wie Gina Becker von Cemex Deutschland und ihre Kollegen mit der Plattform von CheckProof die Tagesproduktion um 75 % steigerten, die Kraftstoffkosten senkten und die Abläufe optimierten.

2024-11-22
A Recap of the CheckProof Industry Event & 10th Anniversary Celebration
CheckProof recently hosted its inaugural industry event, marking a significant milestone in the company’s journey. CheckProof’s industry event, which coincided with our ten-year anniversary celebration, was formed with the intention of gathering industry leaders within the construction materials and heavy industries. Together we discussed common challenges, shared success stories along with informative content on trends that the industry needs to be aware of.
2024-11-11
Trend Report: Key moments in the Construction Materials industry (2014–2024)
To celebrate a decade of innovation since CheckProof’s inception in 2014, this report highlights significant milestones across the construction materials industry over the last ten years. From 2014’s economic optimism boosting infrastructure demand, to more widespread adoption of AI and machine learning in 2024. Each year showcases industry advancements that pushed the boundaries in innovation, digitalization, and sustainability.

2024-11-11
Meet Marcus Edlund, CheckProof’s First Employee and Tech Trailblazer
As we celebrate a decade of innovation, we’re excited to sit down with CheckProof’s first employee, Marcus Edlund, who joined CheckProof in 2016. In this interview, we share his journey, insights, and impact on CheckProof’s growth.